Looks aren’t everything. But great proposal design makes a great first impression. Clean and professional graphics influence the evaluators’ perception of your business and its capabilities. Here are some ways to create better graphics.
TYPOGRAPHY
Are there required fonts for graphics in your proposal? If not, Google Fonts are free and have many contemporary and clean typefaces that are far better than TNR or Arial. Here are a couple:
Roboto is a classic san-serif with a condensed version that’s perfect for graphics.
Merriweather is a great serif option for body copy and comes in a range of weights.
- Don’t use more than two fonts in your proposal—relegate one to text and one to graphics. The fonts above come with plenty of weights and with italics will give you more than enough options.
- Make sure white text on a dark background is legible on-screen and when printed. It can be more difficult for some readers to see.
- Remember, graphics add clarity and communicate what words alone can’t. Adding a lot of text to a graphic defeats the purpose. Let your graphics do the talking.
RESOLUTION
- When in doubt, make sure your graphics are large enough—always create them at full-size. Trying to enlarge an image in layout almost always results in pixelation or blurriness.
- Instead of pasting graphics into your MS Word layout, use Insert. This retains image resolution.
- Use stock photos for guaranteed image quality, and always download the high-resolution version of your images. Nothing looks shabbier than dark, muddy, or blurry imagery.
If you follow these rules, your graphics will render well even when printed.
DESIGN

- Keep it classic. Just because you can make a pie chart 3D doesn’t mean you should. Steer away from other distracting effects like drop shadows and bevels.
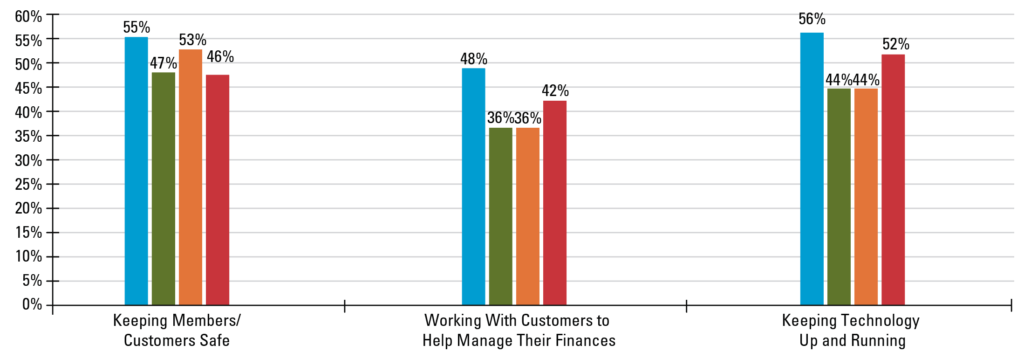
- Keep it clean. Sometimes graphics need to be complex to display complex data. But they don’t need to be cluttered. Look at them with a critical eye and eliminate excess graphic elements. Take a look at this bar graph:
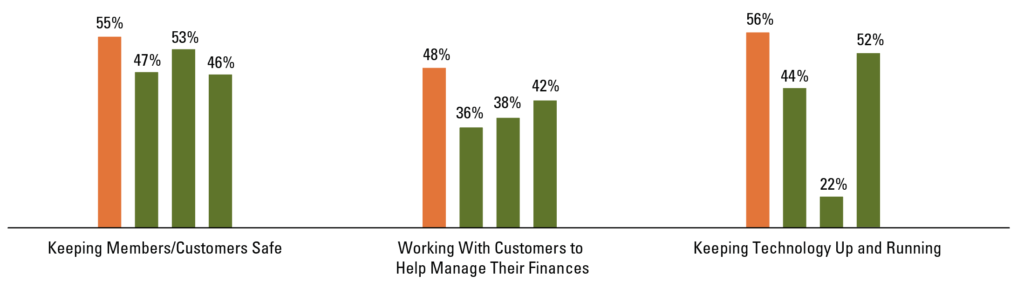
In the simplified version below, the y-axis, background lines, and hash marks on the x-axis were all removed. The remaining elements were spaced out a bit to give them some breathing room, and color was used more strategically to emphasize certain data. With less visual clutter, the entire graph could be made a bit smaller.
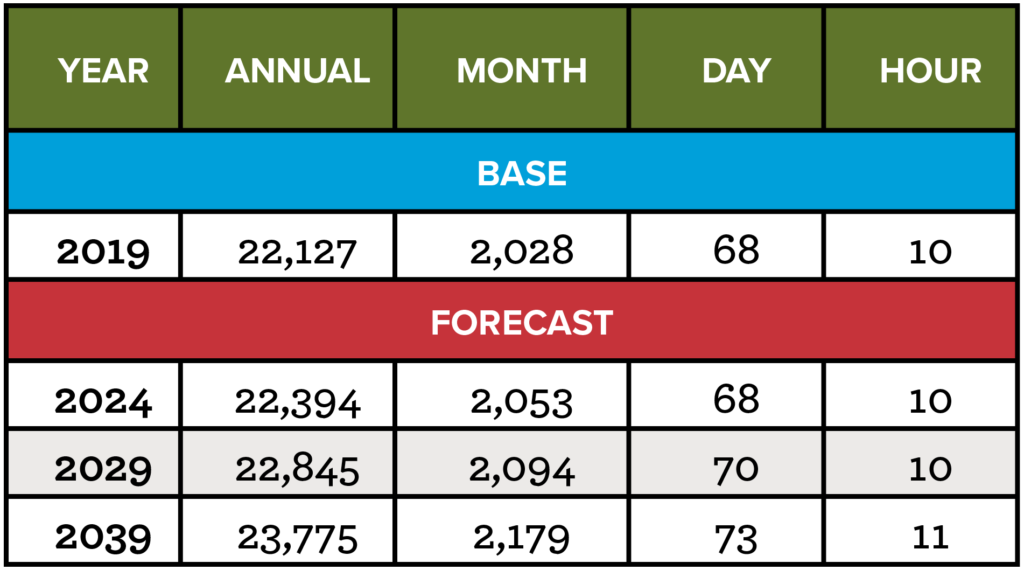
The same principles above apply to tables. Most of the vertical and horizontal grid lines can be removed altogether. Here’s the same table, before and after:
BEFORE:
AFTER:
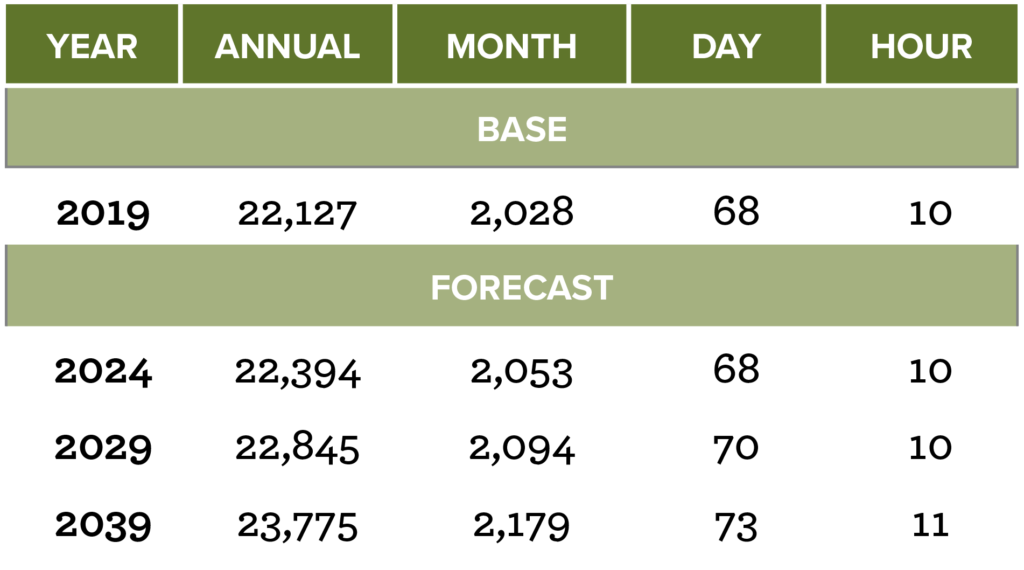
In the After version, you’ll notice that the colors were simplified as well. Only one color was used, with some shading. Reducing the visual clutter made it more attractive and easier to read.
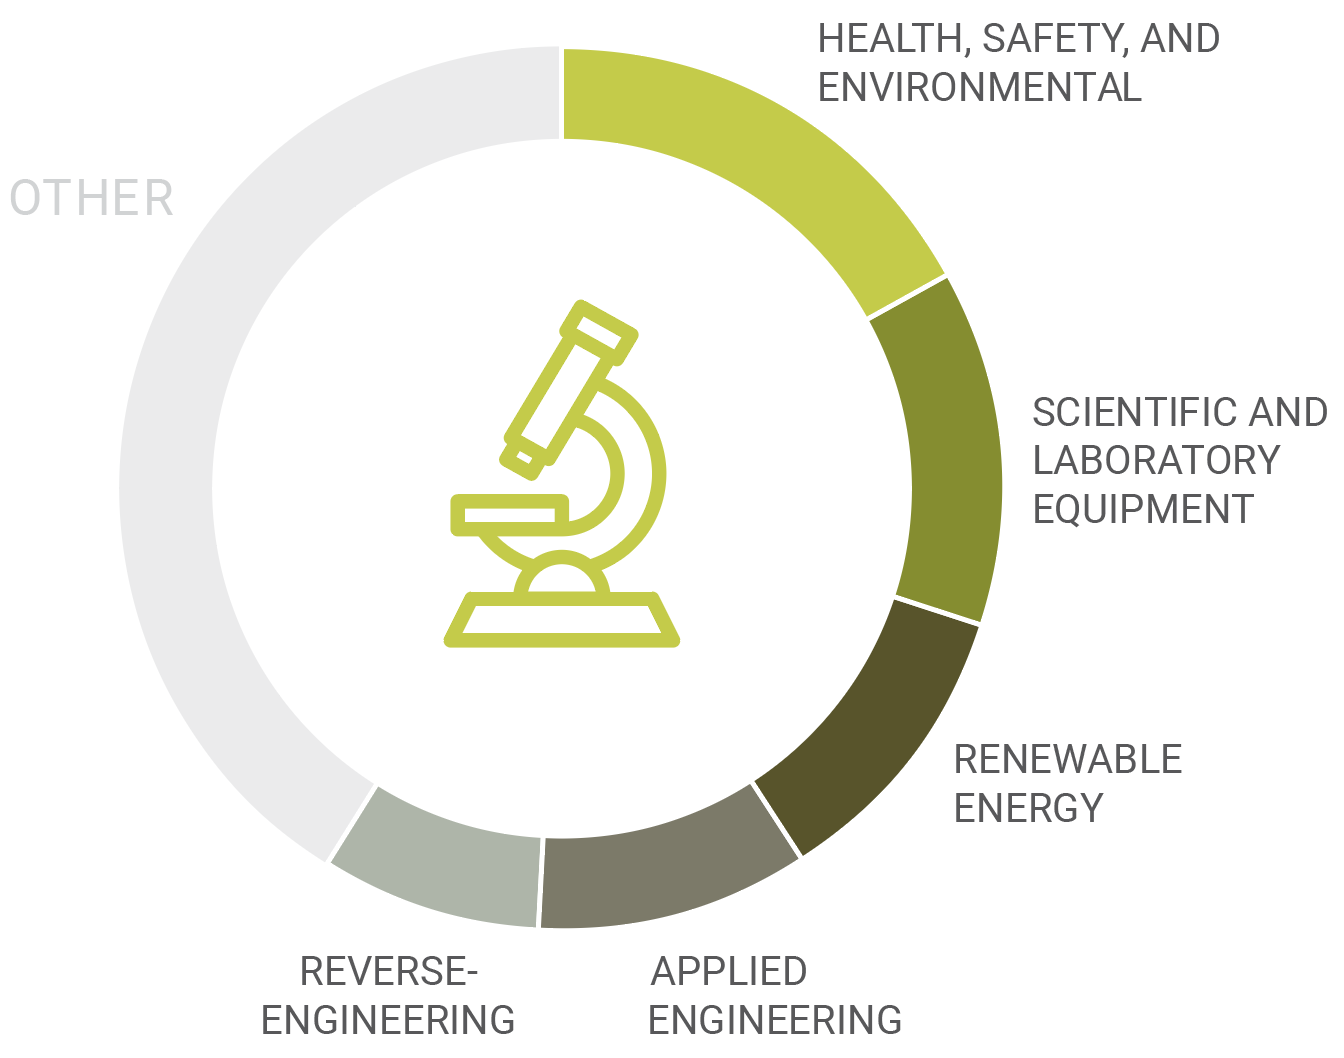
Keep it interesting. It’s not a bad idea to mix things up a bit. The pie chart below has a few graphic tweaks that make it more interesting but just as easy to read. Notice that it uses only shades of two similar colors. There’s plenty of contrast, but the colors aren’t too bright or distracting.
Creating a visually pleasing proposal can be tough. But applying these design and layout tricks to your next proposal will give your business a boost over the competition.